What is E-Mobility?
Gartner defines electro mobility, or e-mobility for short, as the use of electric powertrain technologies, IT technologies, and connected infrastructures to move a vehicle. Powertrain technologies include fully electric vehicles, plug-in hybrids, as well as hydrogen fuel cell vehicles that convert hydrogen into electricity.
The automotive industry stands at a pivotal point, facing both significant challenges and unprecedented opportunities. While the industry faces challenges such as reaching cost parity for EVs and developing charging infrastructure, it also stands on the brink of transformative changes. The coming years will likely see a continued acceleration of electrification, increased technology integration, and reshaping traditional business models in the automotive sector. Read more about the state of the automotive industry and future outlooks in 2024 .
The image of an electric vehicle, or EV, probably comes to mind when we talk about e-mobility. The rise of electric vehicles has been talked about in recent years. As per the latest report from the International Energy Agency (IEA), The global electric vehicle (EV) market continued its rapid expansion last year, with electric car sales nearing 14 million units. This surge in sales brought the total number of electric cars on the road to 40 million.

However, it is important to remember that e-mobility is much more than just passenger cars. The development of e-mobility should also be accompanied by the development of transportation in all forms: e-buses, car sharing, e-scooters, e-bikes, e-boats, bike paths, pedestrian areas, and others because reworking the mobility network means revolutionizing the culture that influences how people choose their mode of transportation.
E-Mobility Market Size and Forecast
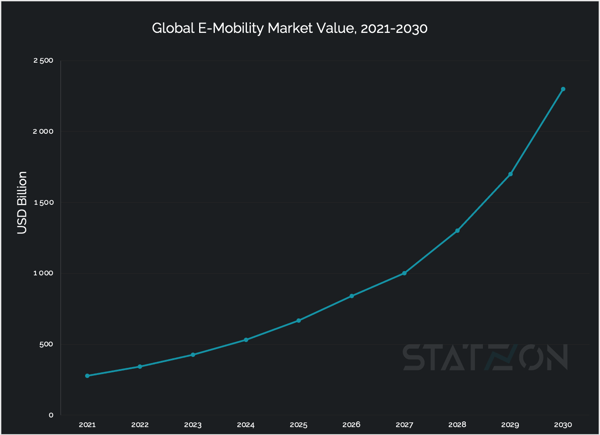
In their report, Next Move Strategy Consulting, forecasted the global e-mobility market will reach USD 2.3 trillion by 2030. The firm included electric cars, electric motorcycles, electric scooters, electric skateboards, and electric wheelchairs in the term of e-mobility.
The 2021 market was valued at USD 279.5 billion, meaning the market will see an annual growth rate of 26.4% to reach the 2030 forecasted value.

The electric car segment accounted for over 65% share of the e-mobility market in 2021 and is estimated to retain its dominance over the forecast period with more or less the same size of market share. In terms of market value, this segment was worth USD 180.5 billion in 2021 and will reach a forecasted market value worth USD 1.5 trillion by 2030.
The electric scooter segment is the second biggest in the market with a revenue of USD 51 billion in 2021 or around 18% market share. The other three segments are electric motorcycle with 13% market share, electric skateboard (2%), and electric wheelchair (2%).
Asia is Leading the E-Mobility Market
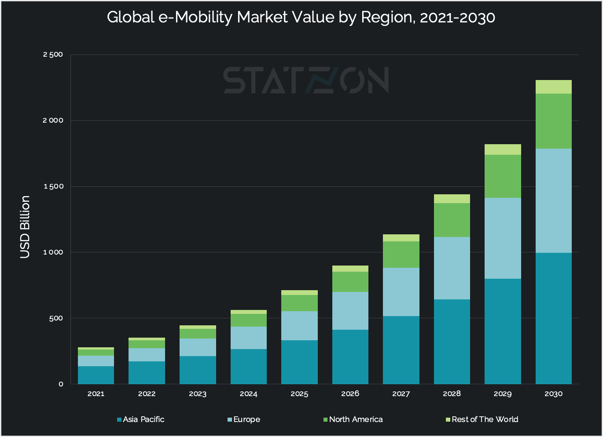
Asia Pacific is at the forefront of the e-mobility movement. This region gained USD 137.5 billion in terms of market value in 2021, taking up 49% of the total market.
China holds the leadership position in the overall e-mobility market in the region and globally. For the year 2021, China generated USD 93.2 billion in revenue, accounting for 33% of the total market. A market much bigger than any other country. China's electric car sales accounted for 60% of global sales. Granted, the country benefits from its huge population which creates a high domestic demand for its local electric vehicle brands. Europe and the US are trailing behind China in terms of sales volume and revenue.
India, Thailand, and Indonesia are lucrative emerging markets and currently the largest micro e-mobility markets with the highest numbers of 2-wheeler electric vehicle sales. India, for instance, surpassed China in 2017 to become the largest market for electric two-wheelers.
Europe e-mobility market was valued at USD 80 billion in 2021, or around 28.5% in terms of market share. The region shows incredible market growth for EV sales and charging infrastructure. Europe market will expand to gain a 34% share by 2030 with a forecasted market value of USD 790 billion. Germany is the leading market in Europe with a market size worth USD 24 billion in 2021. Home to big automotive manufacturers such as Volkswagen, Mercedes, and BMW, Germany wants to take a leading role in the production and use of electric vehicles in this e-mobility era.
Rapid growth of electric car registrations in Europe can be attributed to government stimulus measures for those buying electric cars instead of traditional ICTs. Sales growth has also been boosted by tax benefits and subsidies applied in many European countries.

Why is E-Mobility Important?
E-mobility is a rising trend, and it’s a trend that is going to stay. The main reason for its growing popularity is that electric vehicles allow us to move away from using CO2-emitting fossil fuels. It helps reduce greenhouse gas emission that contributes greatly to air pollution. Electric cars for personal use have gained significant attention and market share in recent years; however, there is now a growing emphasis on electrifying both light and heavy-duty commercial vehicles.
According to the Asian Development Bank (ADB), the transport sector emitted around 7.5 billion tons of CO2 in 2015, representing 18% of all man-made CO2 emissions. The International Energy Agency predicts transport emissions will grow 50% higher by 2060 with strong growth, especially from trucks and buses.
Electrification of transport modes offers a promising future for reducing this negative outcome of the transport sector. With the Paris Agreement, many nations have agreed on an international treaty against climate change. The world is set to reduce emissions by 45% by 2030 and reach net zero by 2050 in order to limit global warming to 1.5C.
However, Bloomberg NEF argues that despite the rapid rise in EV adoption, road transport is still not on track for carbon neutrality by 2050. To reach that net zero global fleet by 2050, electric vehicle sales need to represent 61% of the total new vehicle sales globally by 2030, 93% by 2035, and 100% by 2038.
Basic Breakdown of Electric Vehicles
.jpg?width=684&name=Emobility%20Types%20of%20EVs%20(1).jpg) Electric vehicles come in different types. Some electric vehicles can rely on fuel cells or gasoline generators to provide electricity instead of powerful battery banks. The unifying factor is that every electric vehicle includes an electric motor to drive the vehicle, either alone or in combination with a gasoline-reliant internal combustion engine (ICE).
Electric vehicles come in different types. Some electric vehicles can rely on fuel cells or gasoline generators to provide electricity instead of powerful battery banks. The unifying factor is that every electric vehicle includes an electric motor to drive the vehicle, either alone or in combination with a gasoline-reliant internal combustion engine (ICE).
One very basic of EVs breakdown is the following:
EV/BEV: Electric vehicles/ Battery Electric vehicles. These are pure electric vehicles relying on a rechargeable battery as the power source to run the vehicle. They can be charged at a power station either at home or at a charging station.
HEV: Hybrid electric vehicles that use both electric power and the traditional internal combustion engine (ICE) that runs on gas. The electric batteries are charged autonomously through the energy from the gas engine. It also uses regenerative braking, meaning the vehicle captures energy every time driver hits the brake and saves it for later use.
PHEV: Plug-in hybrid vehicles are a variety of hybrid electrics that can be plugged in to charge with a larger battery than normal hybrids (HEVs). The vehicle can be charged at home or at public stations just like an EV. For some people, this is a nice compromise as it gives you a taste of EV with the security of a gas tank when doing long trips.
FCEV: Fuel cell electric vehicles that run on compressed hydrogen that is combined with oxygen inside a fuel cell stack to generate electricity. No electric batteries are used in this type of vehicle
How Much Cleaner is E-Mobility Compared to Conventional Transport Mode?

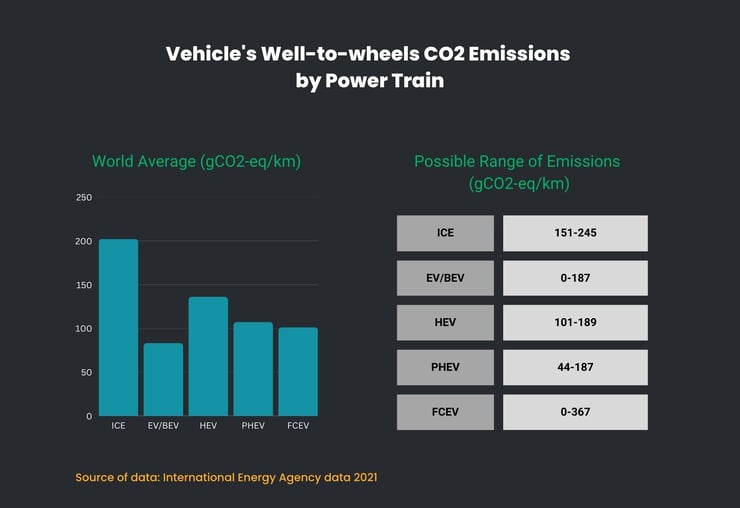
When vehicles are running on electricity, they produce zero tailpipe emissions, but emissions may be produced by the source of electrical power such as a power plant. In areas that use relatively clean sources for electricity then the electric vehicles will have lower well-to-wheel emissions in comparison to conventional vehicles running on gasoline or diesel. In regions heavily dependent on coal for electricity, the well-to-wheel emissions will increase even when the vehicle is running fully on electricity.
Transport & Environment Organization found out that in the worst-case scenario, an electric car with a battery produced in China and driven in Poland still emits 37% less CO2 than cars running on gasoline. And in the best-case scenario, an electric car with a battery produced in Sweden and driven in Sweden, the emission is 83% less.
Another study by International Council and Clean Transportation (ICCT) was looking at the amount of greenhouse gas emissions created by EVs in different countries. Fully electric vehicles (EVs) by far produced the lowest emissions compared to other cars with different types of powertrains. Medium-size EVs' greenhouse emissions are lower than comparable gasoline cars by 66%–69% in Europe, 60%–68% in the United States, 37%–45% in China, and 19%–34% in India.
Barriers to EVs’ Adoption
.png?width=475&height=844&name=E-mobility%20adoption%20barriers%20(900%20%C3%97%201600px).png) As of today, electric cars are on their way to ride the mainstream wave. Range anxiety remains a barrier to the widespread adoption of EVs. Battery capacities of current EVs range from 17.6 kWh in the Smart EQ, which translates to a maximum of 58 miles drive, to 100 kWh in the Tesla Model S which offers a maximum range of 351 miles. More recently, Lucid Air became the world’s longest-range EV offering 520 miles of driving range.
As of today, electric cars are on their way to ride the mainstream wave. Range anxiety remains a barrier to the widespread adoption of EVs. Battery capacities of current EVs range from 17.6 kWh in the Smart EQ, which translates to a maximum of 58 miles drive, to 100 kWh in the Tesla Model S which offers a maximum range of 351 miles. More recently, Lucid Air became the world’s longest-range EV offering 520 miles of driving range.
When it comes to the act of purchase, nothing is as important as the price. Electric vehicles are perceived as expensive, especially when people keep associating EVs with Tesla which positions itself as a luxury brand.
EVs have a higher up-front cost than gasoline cars but are less expensive over the course of their lifetime, mainly because electricity is relatively affordable. The average price of an EV in the US in 2022 is about USD 66,000. By comparison, mid-sized cars are about USD 32,000 and full-sized cars are USD 44,000. EV sticker price is more aligned with the price of a luxury car than mainstream.
Despite many forecasts saying the price of EVs will go down over the years, the pandemic actually increased the price of EVs even more due to shortages of batteries, lithium, and components like semiconductors. Demand for EVs is still strong, however, especially from affluent buyers, making manufacturers more inclined to produce luxury EVs.
Charging issues are another barrier to EV adoption. The issues include problems such as charging speeds, charger inaccessibility, cost of chargers, and charging variance by vehicles.
Charging points are relatively easy to find in urban settings. They are available on popular roadways, motorways, and service areas. The same cannot be said when a driver finds themselves in rural area. Locating a charging station in such area can be cumbersome and once user finds a station, they may face another problem with charger type or connector fit. Current OEMs often created a charging system exclusive only to specific EVs which can be confusing and intimidating for potential EV consumers.
However, a transformative solution is on the horizon: wireless EV charging. This technology is revolutionizing electric mobility by seamlessly integrating recharging into daily life. Unlike traditional wired connections, wireless charging enhances the convenience, efficiency, and appeal of EVs for both individual drivers and fleets. The global wireless EV charging market, valued at USD 13.1 million in 2022, is projected to reach USD 567.7 million by 2030 with an impressive CAGR of 55.6%. While current challenges persist, the evolution of wireless charging offers a promising path to accelerate the EV revolution.
Batteries and Chargers: Important Components of E-Mobility
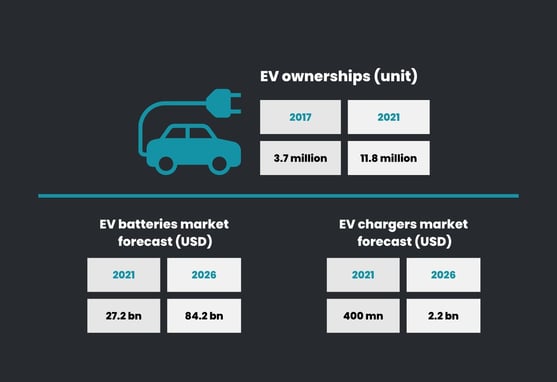
As electric vehicle gains popularity so does every other infrastructure and support solution that enables the vehicle to function. Battery, for instance, is a fundamental part of e-mobility. The cost of the battery accounts for 35%-45% of the EV’s sticker price. MarketsandMarkets forecasted the market size for EV batteries will grow tremendously from USD 152 billion in 2024 to USD 297 billion in 2029. Today's key focus for OEMs is achieving the optimum battery life, reduced cost, faster charging, and bigger power.
Charging station is an important infrastructure for e-mobility. Its availability can actually influence customers’ purchase decisions. Although the number of stations has spurted over the years, they are not equally dispersed. Taking Europe as an example, 70% of all charging stations in the region are located in The Netherlands, Germany, and France. This is an opportunity for the market to keep growing. We can expect the market for EV charging stations to grow from USD 31 billion in 2024 to USD 259 billion in 2035, based on data provided by Market Research Future.
And now, as the focus shifts towards the electrification of commercial vehicles and fleets, the need for electric fleet charging becomes more crucial. This sector makes up about 35% of the total charging infrastructure market. The growth of fleet charging stations is key for businesses looking to switch to electric, offering a direct path to lower emissions and operational costs.
Charging cables, another essential component for electric cars, are used to connect the car's charger to the charging station be it at home or in public. They come in different types that can determine the time you need to charge your vehicle. The EV charging cable market size reached USD 1.5 billion in 2024, according to Markets and Markets. This number is expected to rise to USD 3.3 billion by 2029.
Electric Commercial Vehicles
Currently, the focus on electrifying transportation has extended beyond personal cars to encompass commercial vehicles, particularly heavy-duty vehicles (HDVs). HDVs, including trucks and buses, play a crucial role in global logistics and public transportation but are also significant contributors to greenhouse gas emissions. In the European Union, HDVs account for 25% of emissions from road transport and more than 6% of total EU greenhouse gas emissions. Globally, the situation is even more concerning, as HDVs are projected to contribute more emissions than light-duty vehicles by 2025.
According to the IEA STEPS projection, approximately 1.1 million zero-emission trucks and buses, including 130,000 tractor-trailers, are expected on the roads by 2030. These vehicles will rely on a mix of slow overnight charging, offering 50-150 kW, and ultra-fast charging exceeding 1 MW.
Responding to the urgent need for efficient and high-powered charging solutions for electric heavy-duty vehicles, the Megawatt Charging System (MCS) emerges as a game-changer in the industry. Designed to cater to the needs of large battery electric vehicles, the MCS offers an impressive charging rate of 3.75 megawatts (3,000 amps at 1,250 volts DC). Initiated by CharIN in 2018, this innovative system extends its utility beyond just trucks and buses to include marine and aeronautical applications, demonstrating its versatility in a range of high-power charging scenarios.
In parallel to MCS, the ChaoJi charging project, initiated by the CHAdeMO Association and the China Electricity Council, has developed its own ultra-high-power standard, known as CHAdeMO 3.0. ChaoJi is designed to charge electric vehicles at up to 900 kilowatts, showcasing a significant presence and influence in the Chinese market. While MCS is focused on a broad range of heavy-duty applications with a higher power output, ChaoJi emphasizes compatibility with existing Chinese and global charging standards, indicating a more region-specific approach.
The Market for Mobility as a Service (MaaS)
New economic models have begun to consider sharing concepts as a way to gain profit. In a sharing economy, assets that are currently not being used, such as parked cars and extra bedrooms, can be rented out. With the growing success of rented items and services, new transportation options have come to the market.
The idea of MaaS is to replace the need to own a vehicle by integrating various forms of transport services into a single mobility service accessible on an "as-needed" basis. A MaaS operator facilitates a diverse mode of transport, be it public transport, car sharing, bike rental, or a combination thereof. For the user, MaaS provides a single application to access mobility with a single payment channel instead of multiple ticketing and payment operations.
Next Move Strategy Consulting estimated the market value of Maas which they divided into four different segments of product types: car rental, car-sharing, ride-hailing, and two-wheeler sharing. It is expected that the total market for MaaS will expand almost 20 times within the forecast period of 2021-2030, from USD 3.3 billion to USD 65.8 billion, registering a 39.5% CAGR.
Autonomous Vehicles
Gartner defines an Autonomous Vehicle (AV) as one that can drive itself from a starting point to a predetermined destination in “autopilot” mode using various in-vehicle technologies and sensors, including adaptive cruise control, active steering (steer by wire), anti-lock braking systems (brake by wire), GPS navigation technology, lasers, and radar.
The transition to an autopilot, self-driving car will not occur so suddenly. As of today, most autonomous cars on the road fall into “semi-autonomous” category with only limited amount of “fully-autonomous” vehicles still in testing phase.
The Society of Automotive Engineers (SAE) defines 6 levels of driving automation ranging from 0 (fully manual) to 5 (fully autonomous). Most cars produced in recent years have the option of Level 1 automation with a few reaching Level 2. Some companies have already announced their production of Level 3 personal autonomous cars, but these will only hit the market a few years from now. Level 4 and Level 5 developments are designed mostly for ride-sharing or public transport uses in mind.
| Level | Driver Involvement | Features |
| Level 0 | No automation. Driver performs all driving tasks. | Warning or temporary assistance features such as emergency braking, blind spot warning, lane changing warning. |
| Level 1 | Driver Assistance. Driver controls vehicle with some driving assist features included in the vehicle design. | Lane steering OR adaptive cruise control. |
| Level 2 | Partial Automation. Driver remains engaged with driving tasks but enjoys vehicle’s combined automatic functions | Lane steering AND adaptive cruise control that can be utilized at the same time. |
| Level 3 | Conditional Automation. Driver does not have to drive but needs to monitor the environment all the time and take control of the car shortly after being alerted. | Traffic jam chauffeur function. |
| Level 4 | High Automation. Driver may have the option to take control, but vehicle is capable of performing all driving tasks under certain conditions. | Robotaxi or driverless taxi. Vehicle may or may not have pedals and steering wheel. |
| Level 5 | Full Automation. Driver may have the option to take control, but vehicle is capable of performing all driving tasks under all conditions. | Similar to Level 4 but features are not limited to certain conditions only. |
The topics of EVs and Autonomous Vehicles (AVs) are inevitably intertwined. The shift to electric-powered vehicles happens almost simultaneously with the development of progressively automated cars. Both concepts aim at a more sustainable means of transport and are being implemented greatly in the shared-mobility scheme. The trend of automation, electrification, and ride-sharing are reinforcing one another and are integral parts of mobility of the future.
Sources: Statzon, ADB, BloombergNEF, AFDC, Lifewire, Transport & Environment, IEA, Exro, Digital Trends, US DOE , iDate report on Future of Mobility, Virta, Interact Analysis, McKinsey, IEA, Worldbank blog, Gartner, SAE
Editor's highlights


