The IEA's Global EV Outlook 2023 report is a must-read for anyone interested in the e-mobility industry. The International Energy Agency (IEA) annually evaluates the electric car market and the state of EV charging infrastructure. This data is then published in their publication, the Global Electric Vehicle Outlook, which examines and highlights recent global advances in electric mobility.
This year's report presents a more comprehensive analysis of the global electric vehicle market, including more countries and two different scenarios for projections.
Newcomers include Austria, Israel, and Turkey, providing a broader worldwide overview of the electric vehicle market.. Additionally, the report has more data on India and Brazil and a separate dataset for EU-27.
Aside from historical data, the report also includes projections up to 2030 based on two scenarios: the more conventional Stated Policies Scenario (STEPS) and the comprehensive Announced Policies Scenario (APS). The STEPS scenario takes a more conservative approach by considering existing policies and measures to reach energy-related objectives. On the other hand, the APS scenario assesses progress towards achieving net-zero emissions by 2050 and assumes full implementation of national targets by 2030 and 2050, including country-level access to electricity and clean cooking targets.
Global Electric Car Market 2022
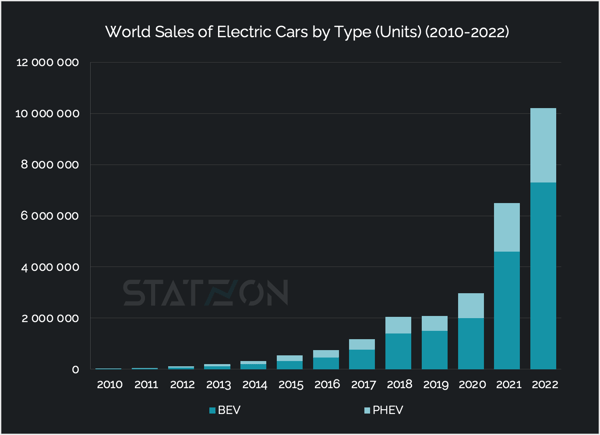
IEA’s Global EV Outlook 2023 shows that electric car sales have increased despite a declining global car market. The combined sales of battery electric and plug-in hybrid vehicles surpassed 10 million in 2022, indicating a 55% rise from 2021. The report also suggests sales for 2023 are expected to grow by another 35%, meaning nearly one in five cars sold globally this year will be electric.
 Source: Statzon/ IEA
The significant surge has resulted in an increase in the electric car market share from 4% in 2020 to 14% in 2022. the market share is expected to further rise to 18% by the end of this year.
When it comes to stock, in total we have more than 25 million electric cars on the roads worldwide in 2022, representing 3.1% of the total global car stock, up from 2.5% in the previous year.
PHEVs constitute a significant portion of the total EV sales, representing approximately 34% of all EVs sold in 2021 and 28% in 2022. However, the proportion of PHEVs is expected to decline in the coming years, with a predicted share of 22% in 2025 and 16% in 2030, based on the STEPS scenario, while the share of BEVs is expected to increase steadily. This is in line with the trend towards more sustainable transportation options and a shift away from fossil fuels. 
Global Sales of Electric Buses and Trucks
As electric car sales have been consistently rising, the same cannot be said for electric buses and trucks. Electric bus sales peaked in 2015 with 68,000 sold globally but have since decreased to 55 000 in 2021 and 63,000 in 2022. Electric truck sales peaked in 2017 with 67,000 sold, but have since fluctuated, with 34,000 sold in 2019, 40,000 in 2021, and 58,000 in 2022.
This non-linear pattern for the sales of electric buses and trucks can be attributed to various factors, such as the lack of charging infrastructure for heavy-duty vehicles, the higher cost of electric buses and trucks compared to their diesel counterparts, and the limited driving range of electric buses and trucks. Additionally, the long operational life of buses and trucks (compared to cars) means that the transition to electric buses and trucks may take longer. According to the STEPS scenario, electric passenger cars are projected to make up 36% of sales by 2030, while the APS scenario predicts 41%. For electric buses and trucks, the STEPS scenario predicts a sales share of 17% and 9% by 2030, while the APS scenario projects a sales share of 22% and 13%, respectively.
Nevertheless, the data indicate that there has been an overall increase in the sales of electric vehicles, including electric buses and trucks, over the years, which is a positive sign for the electric vehicle market.
China and Norway, Still the Prominent EV Market Leaders
The bulk of electric car sales have been predominantly concentrated in three major markets: China, Europe, and the United States. China totally dominated the electric car market, making up 60% of the global sales. Over half of the world's electric cars are in China, and the country has even exceeded its 2025 targets for new energy vehicles. China will most likely retain its leadership position in the coming years, despite the phasing out of EV policy incentives. China’s success probably lies in its success in producing smaller EV models with prices edging lower towards those of their combustion engine equivalents.
China sets a target of 50% of electric car sales share by 2030 across "key pollution control regions" and 40% across the country remains in place.
Norway, on the other hand, does not lead in number of sales but the country has maintained its position as the top country for electric car sales share, just like in the previous years. In 2022, the country achieved an electric car sales share of 88%, which is an improvement from the 86% recorded in 2021. However, it is apparent that Norway is gearing towards full electricity. In 2022, only 16,000 PHEVs were sold in Norway, a meager 10%of the total electric car sales for the year. It was a considerable decrease from the 38,000 sold in 2021.
Furthermore, Norway boasts the highest percentage of electric vehicles among all passenger cars sold in 2022, reaching an impressive 27%. This figure is considerably higher than the global average of 2.1%. Even China, a world leader in electric car production and sales number, only achieved an electric car stock share of 5% in 2022.
Electric Vehicle Sales in Emerging Markets
Emerging markets have been slower in adopting electrified four-wheeled transport due to the high cost of electric vehicles (EVs) which have yet to reach price parity with internal combustion engine (ICE) cars. With the exception of China as emerging market, Climatescope 2022 Electrified Transport Factbook recognizes Ukraine, India, and Brazil as the three biggest EV markets among developing nations, accounting for over half of emerging markets (ex-China) sales. Other emerging markets with top EV sales rates include Romania, Croatia, Taiwan, and Turkiye.
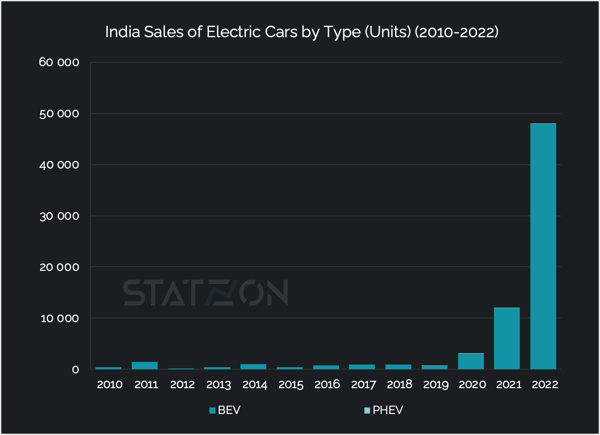
India aims to reach net zero emissions by 2070 and we can see some serious movement that they have been taking to reach that target. Focusing on BEV, India's sales of battery-electric passenger cars jumped from 12,000 vehicles in 2021 to 48,000 in 2022. A fourfold increase in just one year. India’s sales share of 2022 stood at 2.5% and is expected to reach 7% by 2025 and 15% by 2025, based on the STEPS scenario.
 Source: Statzon/ IEA
India also put special emphasis on electrifying its bus fleet. The number of operating electric buses in the country is growing from 550 in 2019 to 1100 in 2020 and to 3100 in 2021. The Indian government has also set a very ambitious goal to put 50,000 electric buses on the roads by 2030 to make sure the country cuts its carbon emissions by 1 billion tonnes by 2030 and reaches zero emissions by 2070.
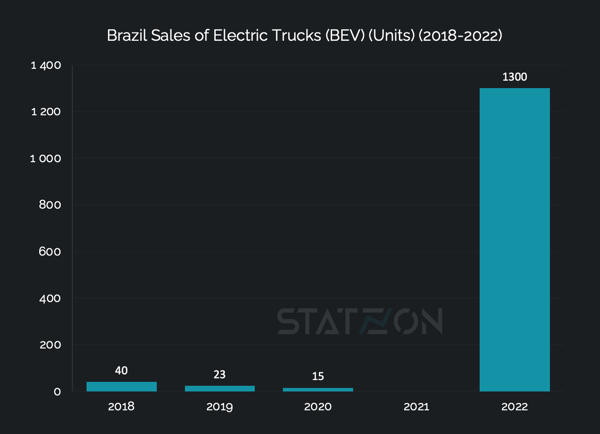
Brazil, on the other hand, shows a serious movement towards electrifying its truck fleet. Sales of electric trucks in Brazil have grown from only 15 in 2020 to 1,300 in 2022. Some of the big names in Brazil's mining industry are now betting on electric trucks as part of their efforts to reduce greenhouse emissions from their activities.
 Source: Statzon/ IEA
However, the most dynamic area of electric mobility in emerging and developing economies is two- and three-wheel vehicles, which far outnumber cars. More than half of India’s three-wheeler registrations in 2022 were electric, demonstrating their growing popularity. In many developing economies, two- or three-wheel vehicles offer an affordable way to access mobility, making their electrification crucial to support sustainable development.
Expansion of EV Charging Infrastructure
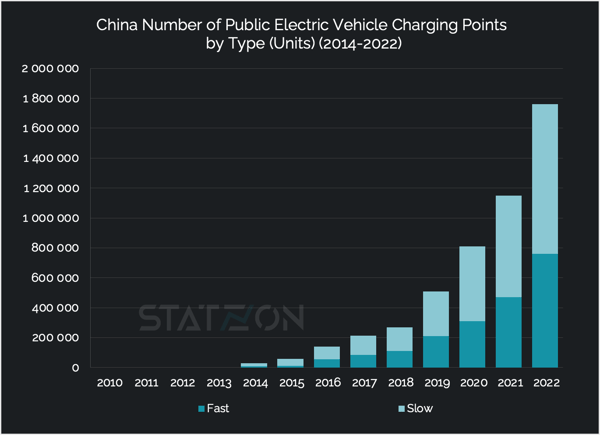
As of the end of 2022, the number of public charging points worldwide reached 2.7 million, with over 900,000 new installations, indicating a 55% increase in comparison to the previous year. This growth is comparable to the pre-pandemic growth rate, which was around 50% between 2015 and 2019. More than 600,000 public slow charging stations were established worldwide, and the number of fast chargers increased by 330,000.
The majority of the growth came from China both for slow and fast charging. China added 320,000 slow charging points and 340,000 fast charging points in 2022, numbers that are way higher than any other country worldwide. In total China accounts for 760 000 fast chargers, but more than 70% of the total public fast charging pile stock is situated in just ten provinces.
In Europe the overall fast charger stock numbered over 70,000 by the end of 2022, an increase of around 55% compared to 2021. The countries with the largest fast charger stock are Germany (over 12,000), France (9,700), and Norway (9,000).
The United States installed 6,300 fast chargers in 2022, about three-quarters of which were Tesla Superchargers. The total stock of fast chargers reached 28,000 at the end of 2022.
Although slow chargers still dominate in numbers, fast chargers are being rolled out at a faster pace and some countries are putting an emphasis on them. For instance, in 2022, India installed nearly 11,000 charging points, with almost 40% of them being fast chargers. Similarly, in Thailand, fast chargers accounted for 54% of the total 3,700 charging points installed that year, while in China, the installation of fast chargers constituted 40% of the total installation of charging points.
 Source: Statzon/ IEA
According to the STEPS scenario, fast chargers are projected to have a 36% share of the total publicly available charging points in the world by 2025. This share is expected to slightly increase to 38% by 2030.
In markets with widespread availability of home charging, such as the US and Norway, the ratio of EVs per public charging point can be as high as 24 and 30, respectively. However, as EV market penetration increases, public charging becomes more important, even in countries with high home charging availability. The optimal ratio of EVs per charger will vary depending on local conditions and driver needs.

Sources: Statzon, CleanTechnica, Climatescope
