Europe is currently ranked second to China in terms of e-mobility. However, China's statistics far exceed those of Europe and any other region in the world. Already, in 2023, China had more than 2.7 million public EV charger points, growing by 1 million since the previous year, as per IEA data. As of December 2024, Europe’s public charging network comprised 882,012 operational points. Mature but Still Growing The European EV charging station market represents approximately 25% of the global share, with a steady compound annual growth rate (CAGR) of 29% projected through 2030. Germany, the UK, and France are at the forefront of the region's development, bolstered by strict emission regulations and government incentives. The region's emphasis on standardization and interoperability has created a more cohesive charging network across borders, although growth rates have moderated as the market matures.
There are things that China did a lot earlier than others to make EVs and EV charging infrastructure ubiquitous in the country. The Chinese government began subsidizing electric car sales in 2010 and enforced a standard plug for EV charging, leading to the high adoption of EVs. Europe has recently drafted some ambitious targets for EVs to align with its “Fit 55 Package”, the EU’s initiative to reduce emissions by at least 55% by 2030 (compared to 1990 levels). Emissions from the transport sector have been rising since the 1990s, accounting for nearly 20% of total EU GHG emissions.
The European Parliament aimed high in October 2022 by voting for a regulation on the alternative fuels infrastructure (AFIR) to ensure a smooth transition to renewable zero-carbon fuel. The regulation highlights the need to increase the power level of public charging, stimulate fast charging deployment, and enable swift deployment of electric charging infrastructure for heavy-duty vehicles. The Alternative Fuels Infrastructure Regulation (AFIR) sets binding targets for member states, including minimum fast-charging densities on significant highways by 2025 and 3.5 million public chargers by 2030. However, ACEA argues that these targets fall short of the 8.8 million chargers needed to support projected BEV adoption rates. Private sector coalitions, such as the E.ON-Eldrive-ZSE consortium (aiming for 1,400 new chargers by 2027), are bridging gaps left by public initiatives.

Where Do People Charge Their Electric Cars?
Residential charging
In Europe, 70% of EV charging occurs at home or at work, where charging outlets have lower power output and longer charging durations, resulting in lower costs. This makes charging at home and at work the most economical option for EV customers. However, providing charging solutions for residents living in apartment buildings, which represent 46% of EU inhabitants, can be challenging, as reported in ChargeUp Europe's State of the Industry 2022 publication. The main obstacle is the shared parking garages, which receive electricity from the common area meter, making it difficult to install personal EV chargers. In addition, local regulations often prohibit direct connections between charging stations in parking garages and corresponding flats. The ongoing revision of the Energy Performance of Buildings Directive (EPBD) presents an opportunity to address this issue.
Almost 80% of residential EV chargers in Europe (90% if we include Benelux) were sold in DACH (Germany, Austria, Switzerland) and France, corresponding with the existing distribution of EVs in these countries.
Residential EV chargers are AC chargers with charging power between 7.4 and 22 kW. Each charging point receives more than four charging sessions per week, totaling an average of 100 kWh/week. More than 95% of home charging sessions take place between 12 PM and 8 AM.
Workplace charging
It's critical to offer workplace charging, especially for individuals without access to a home charger. Nordic countries and France have the highest share of workplace charging at 60% combined, followed by Benelux and DACH. Workplace chargers usually offer AC charging with a capacity of 22 kW. Despite its significance, workplace charging constitutes less than half of the total residential charging units.
Each workplace charging point receives more than eight charging sessions on average for each week, totaling 400 kWh/ week. Around 75% of workplace charging sessions happen between 8 am and 4 pm, with the remaining 25% happening between 4 pm and 12 am.
Public charging
Public charging options include AC and DC charging points. The majority of publicly available charging infrastructure is AC charging stations with a maximum of 22 kW power. Countries with a high density of charging points tend to offer more AC chargers than DCs.
The latest data from the European Alternative Fuel Observatory (EAFO) shows that by the end of 2024, the European Union had over 882,012 public charging points, with 16% being DC chargers and 84% AC chargers. The number of DC chargers has been growing slightly faster over time.

Source: European Alternative Fuels Observatory (EAFO)
(2020-2024).png?width=650&height=473&name=Total%20number%20of%20publicly%20accessible%20AC%20recharging%20points%2c%20according%20to%20the%20AFIR%20categorization.%20(UNITS)(2020-2024).png)
Source: European Alternative Fuels Observatory (EAFO)
%20(2020-2024).png?width=650&height=471&name=Total%20number%20of%20publicly%20accessible%20DC%20recharging%20points%2c%20according%20to%20the%20AFIR%20categorization%20(UNITS)%20(2020-2024).png) Source: European Alternative Fuels Observatory (EAFO)
Source: European Alternative Fuels Observatory (EAFO)
Public charging points are divided into two types: "fully" public and "semi-public." Fully public charging points, making up 64% of the total, are accessible anytime and located in public areas like streets or highways. On the other hand, semi-public charging points, constituting 36%, are situated on private properties with restricted access, such as in car parks, underground garages, supermarkets, and hotels, and may have limited hours or require using the property's facilities.
A study by GridX recorded a total of 137,258 charging stations across 28 countries (25 EU countries plus Norway, UK, and Switzerland). Most of these stations (46%) have two charging points. This is followed by charging stations with four charging points (19%), then one and three charging points as the third most common (10%). Only 14% of stations have five or more chargers, and only 1% can simultaneously serve 20 or more vehicles.
A few stations have 100 charging points or more. But these stations are exceptions, certainly not the norm, as only 0.03% of charging stations fall into this category. 0.15% of stations provide 50 or more charging points.
Ultra-Fast High-Power Charging (HPC)
The High-Power Charging (HPC) network is vital for the rapid expansion of electric vehicle usage across Europe. Under the Alternative Fuels Infrastructure Regulation (AFIR), HPC stations are classified into two distinct levels: Level 1 ultra-fast DC recharging points provide an output of 150 kW up to less than 350 kW, while Level 2 ultra-fast DC recharging points deliver a power of 350 kW or greater, facilitating the fastest charging times available. Within the EU27, HPC stations make up 59% of the total public charging points.
Uneven Distribution of Charging Infrastructures
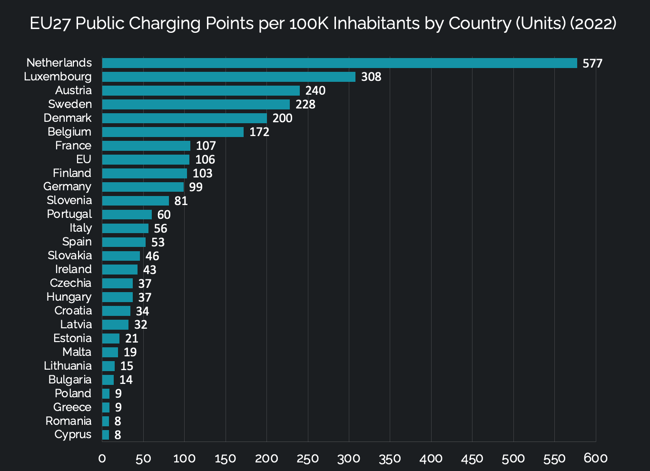
Three nations—the Netherlands, Germany, and France—host 61% of all EU charging points despite occupying just 22% of its land area. This imbalance reflects divergent national policies, subsidy frameworks, and private investment levels. Germany’s €6.3 billion commitment to infrastructure expansion and France’s rural charging subsidies contrast sharply with lagging efforts in Croatia, Estonia, and Latvia, where charger counts remain below 1,100. The EAFO’s 2024 analysis highlights Eastern Europe’s focus on high-power-per-charger installations (e.g., Bulgaria, Estonia) versus Western Europe’s emphasis on network breadth.
Urban areas account for 78% of charging points, leaving intercity routes and rural regions underserved. AFIR’s 2025 mandate for 150 kW fast chargers every 60 km along the TEN-T network aims to address this, but compliance will require unprecedented coordination among member states. Cross-border travel remains hindered by fragmented payment systems and connector compatibility issues, though initiatives like the ChargeUp Europe-ACEA partnership seek to harmonize standards.
Source: Statzon/ ChargeUp EUROPE
Are There Enough EV Charging Points in Europe?
As of 2024, Europe’s public charging network comprised 882,012 operational points, a sevenfold increase from 127,170 in 2020. In 2024, there was about 11 BEVs and PHEVs per public charging point or 6.7 BEVs per charging point. This ratio in 2020 was 16 vehicles per charging point. The majority of these chargers utilize Type 2 connectors (AC charging up to 22 kW) and Combined Charging System (CCS) connectors (DC fast charging up to 350 kW), which dominate 90% of the market. Fast and ultra-fast chargers (≥150 kW) represent a growing segment, critical for long-distance travel and commercial fleets, though their deployment remains concentrated along significant transport corridors.
With approximately 7 BEVs per public charging point, Europe currently exceeds the EU’s recommended ratio of 1 charger per 10 BEVs. Plug-in hybrids (PHEVs), which rely on public infrastructure, further strain this ratio. Regional disparities exacerbate the issue: urban centers like Amsterdam and Berlin benefit from dense networks, while rural and Eastern European regions face acute shortages. For instance, France, Germany, and the Netherlands each have more than 150,000 recharging points, while most of Eastern Europe has only a few thousand charging points each.
An analysis from McKinsey suggests that the European Union will need at least 3.4 million operational public charging points by 2030 to enable a complete switch from ICEs to EVs. This figure includes 2.9 million public chargers for passenger cars, 0.4 million for light commercial vehicles, and 0.1 million for trucks and buses. It does not include the estimated 29 million residential and workplace chargers.
Nevertheless, the predominant mode of charging in the future is anticipated to remain within private domains. By 2030, residential charging is forecasted to comprise the lion's share, making up 79% of all charging, followed by workplace charging at 15%.
More Charging Points, More Grid Power
Major improvements to the grid system will be required for the proper distribution of electricity to the millions of new charging stations in the future. According to McKinsey's estimation, EV electricity demand could potentially rise from nine terawatt hours (which is less than 1% of EU total electricity consumption) in 2021 to 165 terawatt hours in 2030. Even though EV-specific electricity demand is predicted to increase by nearly 40% annually, it is only taking up about 6% of the total electricity consumed in the EU.
The Electric Vehicle Charging Infrastructure Masterplan
The European Automobile Manufacturers’ Association (ACEA) has developed a proposed guideline called The Electric Vehicle Charging Infrastructure Masterplan. This masterplan lays out an even more aggressive deployment target for the EU to achieve the Fit 55 Package. It covers all EU-27 countries and various vehicle types with a focus on access to charging infrastructure and driving range for electric vehicles (passenger cars, light commercial vehicles (LCVs), trucks, and buses). An estimated EUR 280 billion needs to be invested by 2030 to install charging points, upgrade the power grid, and build renewable energy capacity for EV charging. The total investment will go up to approximately EUR 1,000 billion by 2050 for a complete transformation to electric road mobility in all EU member countries.
In accordance with the Fit 55 Package, the 2030 goal is to reduce passenger cars’ and LCVs’ emissions by 55% and emissions from trucks and buses by 30%. To achieve this goal, EV share should be ramped up to 17% for passenger cars, 13% for LCVs, and 3.5% for trucks/buses. That’s an estimated 42.8 million EVs (BEVs and PHEVs), 4.4 million electric LCVs, and 0.3 million electric trucks and buses on the road by the end of 2030.
A rapid rollout of charging infrastructure is crucial to realize this goal. An imbalance in the number of charging points and EVs would only hinder customers from leaving ICEs behind. The EV Charging Masterplan recommends that a total of 6.8 million public chargers for passenger cars, 0.7 million for LCVs, and 0.1 million for trucks and buses be installed by 2030. This means deployment rates must increase from less than 2,000 public charging points per week in 2021 to over 23,000 per week in 2030, with an average deployment of 14,000 between 2021 and 2030. A lot higher than McKinsey’s 6,000 installations per week recommendation.
Search for More EV Related Insights from Statzon
Sources:
- Global Electric Vehicle Charging Station Market - Statzon / Market Research Future
- Statzon EV charging data and insights
- China - Number of Public Electric Vehicle Charging Points by Type (Units) (2014-2023) - Statzon / IEA
- Electric cars: Half of all chargers in EU concentrated in just two countries - ACEA
- 01 Automotive Insights April 2024 - ACEA
- Electric cars: 6 EU countries have less than 1 charger per 100km of road; 1 charger in 7 is fast - ACEA
- Europe’s EV charging market is shifting gear, but navigating roadblocks - Consultancy
- The state of the EV charging market in Europe - Tripica
- Europe’s EV opportunity—and the charging infrastructure needed to meet it - McKinsey
- EAFO Analysis: Trends in EV Charging Infrastructure Across Europe - EAFO
- European Union (EU27) Data - EAFO
- Charging point deployment versus sales of electrically-chargeable cars - ACEA
- ChargeUp EUROPE State of The Industry 2023 report
- European EV Charging Report 2024 - GridX
