EV Sales Share in the United States
In early 2023, Cox Automotive anticipated that EV sales in the US would surpass the 1 million mark, a prediction that materialized by the year's end. Indeed, in 2023, a remarkable nearly 1.2 million US vehicle buyers opted for electric vehicles, marking a record-breaking surge, according to the latest data from Kelley Blue Book, a Cox Automotive company. EVs emerged as the fastest-growing segment in car sales, capturing a 7.6% share of the total US vehicle market in 2023, up from 5.9% in the previous year.
Q4 of 2023 witnessed an unprecedented milestone in EV sales, with both volume and market share reaching record highs. Sales during this period surged by 52% compared to the fourth quarter of 2022, with Americans purchasing 317,168 EVs between October and December 2023, accounting for 8.1% of all new car sales.
The year 2023 saw electric vehicles commanding 7.6% of total US sales, a significant increase from 5.9% in 2022 and 3.2% in 2021. Forecasts by Cox Automotive research suggest that this figure is expected to surpass the 10% mark for the first time in the coming year.
EV sales shares have grown at a faster rate than sales shares of conventional hybrids that don’t have a plug: It took about 25 years for hybrids to reach a 10% market share, compared to about 12 years for EVs.
Average EV Price in the United States
EV prices have shown signs of stabilization, maintaining their status as a premium segment in most cases. However, in 2023, Tesla's aggressive price reductions triggered a ripple effect throughout the automotive industry, leading to a significant decrease in the average transaction price for electric vehicles. Consequently, by December of that year, the average price for a Tesla vehicle had dropped to USD 50,051, nearly aligning with the average price of internal combustion engine (ICE) vehicles, which stood at USD 48,759. This trend extended beyond Tesla, with the broader auto industry witnessing a decline in the average EV price to USD 50,798, marking the closest proximity to ICE prices in history.
Tesla's strategic maneuvers sparked a price war in the auto sector, prompting competitors to follow suit and reduce their EV prices. This concerted effort resulted in a narrowing gap between the average prices of EVs and traditional ICE vehicles, indicating a significant shift in market dynamics.
By January 2024, the average price paid for a new electric vehicle saw a slight increase, reaching USD 55,353, despite still representing a notable year-over-year decline of 10.8%. For comparison, the average price of a new car, regardless of powertrain, in the same month was USD 47,401, meaning that the average price paid for a new EV was 17% higher than the overall new car market average. EV price is closer to the average price paid for a luxury brand vehicle in January which was at USD 60,978
On a positive note, EV incentives experienced a substantial increase, with many models seeing incentives more than triple over the past year. This uptick in incentives further enhances the affordability and attractiveness of electric vehicles in the market.
These price adjustments and increased incentives have made EVs more accessible to consumers, contributing to a surge in EV adoption. In January 2023, the Hyundai Ioniq5's incentives were less than 3% of average transaction prices (ATP), but by January 2024, they had surpassed 18%. The Tesla Model Y, a key player in the EV market, saw its prices plummet by more than 21% over the past year, dropping from nearly USD 63,000 in January 2023 to less than USD 50,000 by the end of 2023.

US Best-Selling Electric Cars 2023
Tesla maintains its stronghold in the US EV market, accounting for 55% of electric vehicle purchases in 2023. Despite a slight decline from its 2022 market share of 65%, Tesla's aggressive price cuts throughout the year helped it maintain its leading position. Notably, the Model Y SUV and Model 3 sedan, now more affordable due to these price reductions, comprised one-third of all EVs sold in 2023. The Model Y, with over 394,000 units sold, emerged as the top-selling EV, representing one in every three EVs sold last year. Meanwhile, the Model 3 secured the second position with 220,910 units sold.
While Tesla remains at the forefront, other automakers, including German luxury brands, are making significant strides in the EV sector. In 2023, BMW saw 12.5% of its total sales come from EVs, while Mercedes-Benz and Audi accounted for 11.4% and 11.0% of their brand sales, respectively. Volkswagen leads among non-luxury brands, with EVs representing 11.5% of its sales for the year.
Chevy Bolt EV experienced its best sales year yet, with 62,045 units sold, while Ford's Mustang Mach-E and F-150 Lightning also saw record-breaking sales figures, with 40,771 electric crossovers and an undisclosed number of electric pickups sold, respectively.
Rivian, a notable EV startup, gained significant traction, selling 24,783 R1S electric SUVs in 2023. With over 50,000 EVs delivered in total, Rivian achieved an impressive growth rate exceeding 100%, solidifying its position as one of the fastest-growing players in the EV market.
The entry of new competitors into the EV market continues to expand consumer choices, with over 70 EV options expected to be available within the next two years, according to Kelley Blue Book analysis.
| ELECTRIC VEHICLE SALES IN THE UNITED STATES | ||||
| Brand | Sales 2023 | Sales 2022 | YOY | Share 2023 |
| Audi | 25,039 | 16,177 | 54.8 % | 2.1 % |
| BMW | 45,417 | 35,589 | 27.6 % | 3.8 % |
| Brightdrop | 497 | 146 | 240.4 % | 0.0 % |
| Cadillac | 9,154 | 122 | - | 0.8 % |
| Chevrolet | 62,988 | 38,120 | 65.2 % | 5.3 % |
| Ford | 72,608 | 61,575 | 17.9 % | 6.1 % |
| Genesis | 6,403 | 1,671 | 283.2 % | 0.5 % |
| GMC | 3,244 | 854 | 279.9 % | 0.3 % |
| Fisker | 2,669 | - | - | 0.2 % |
| Hyundai | 57,561 | 30,339 | 89.7 % | 4.8 % |
| Jaguar | 297 | 298 | -0.3 % | 0.0 % |
| Kia | 30,036 | 27,959 | 7.4 % | 2.5 % |
| Lexus | 5,386 | - | - | 0.5 % |
| Lucid | 5,940 | 2,669 | 122.6 % | 0.5 % |
| Mazda | 100 | 324 | -69.1 % | 0.0 % |
| Mercedes | 40,458 | 32,483 | 24.5 % | 3.4 % |
| Mini | 2,770 | 3,584 | -22.7 % | 0.2 % |
| Nissan | 20,216 | 12,025 | 71.4 % | 1.7 % |
| Polestar | 12,215 | 9,322 | 31.0 % | 1.0 % |
| Porsche | 7,570 | 7,271 | 4.1 % | 0.6 % |
| Rivian | 50,189 | 20,632 | 143.3 % | 4.2 % |
| Subaru | 8,872 | - | - | 0.7 % |
| Tesla | 654,888 | 522,388 | 25.4 % | 55.1 % |
| Toyota | 9,329 | 1,217 | 666.6 % | 0.8 % |
| Vinfast | 3,129 | - | - | 0.3 % |
| Volvo | 13,887 | 7,605 | 82.6 % | 1.2 % |
| VW | 37,789 | 20,511 | 84.2 % | 3.2 % |
| Total | 1,189,051 | 812,821 | 46.3 % | |
Source: Kelley Blue Book
EV Market Outlook in The United States
The outlook for electric vehicle (EV) sales in the United States reflects a mixed landscape of challenges and opportunities. Amidst the headwinds of negative press and a slowdown in the growth rate, the trajectory remains upward. Major automakers such as Ford and General Motors have scaled back production targets in response to softening demand, a trend that mirrors the global market situation. In Germany, for example, EV sales have seen a decline, while Chinese manufacturers are becoming increasingly competitive internationally.
Globally, the EV market is experiencing a similar recalibration. In Europe, a significant downturn has been observed, with German EV sales, including plug-in hybrids, falling 16% in the previous year, and a further 9% decrease forecasted for 2024. This is indicative of a broader European market softening, as consumer demand wanes and competition from Chinese manufacturers intensifies.
China itself, after a period of booming EV sales, is confronting a domestic market slowdown. This has prompted Chinese EV companies to expand internationally, increasing competition in a global market that is already facing a transitional challenge. Moreover, Korea’s LG Energy Solution anticipates slower global market growth, reflecting a widespread industry trend.
Despite these challenges, BNEF reports suggest that the perceived global EV slowdown may be overstated. Firms like Hyundai, Kia, and Volvo have reported robust U.S. demand, with no signs of a downturn in orders. The commitment to an electric future remains strong across the industry, with automakers planning to sell more EVs than ever.
The U.S. market, in particular, proves challenging to forecast. While some automakers indicate a softening demand, Tesla's ongoing success and Hyundai and Kia's sustained demand paint a diverse and unpredictable market landscape. Expected to reach nearly 1.9 million in sales, accounting for 13% of new vehicle purchases, the U.S. market could still face setbacks, particularly as political divides intensify.
Despite these uncertainties, consumer sentiment towards EVs seems optimistic. Surveys by McKinsey, J.D. Power, and Consumer Reports signal a growing readiness among Americans to embrace EVs, with 30% of drivers saying they would not consider gasoline vehicles from their future options. While concerns about affordability and charging infrastructure linger, they are being actively addressed. The Inflation Reduction Act of 2022 introduces new tax credits of up to $7,500 for new EV purchases and a surge in investments, totaling more than $21 billion towards charging infrastructure, is set to expand the network of public chargers from around 160,000 in 2023 to nearly 1 million by 2030. Although the U.S. represents just about 11% of the global EV market, its evolution is poised to significantly influence the overarching narrative in 2024.
How Many EV Chargers are there in the United States?
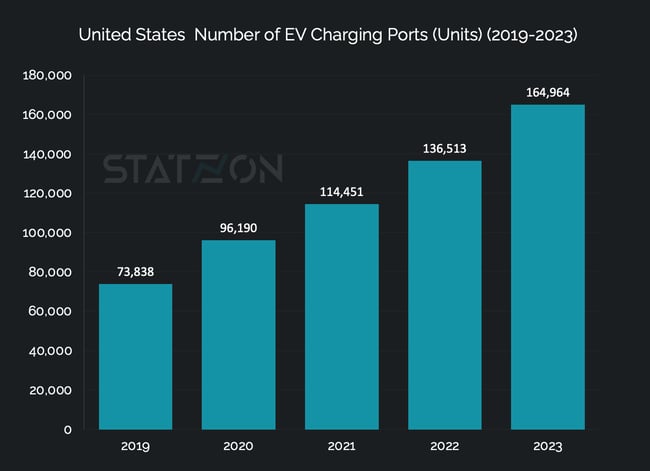
Approximately 80% of electric vehicle charging takes place at home, but access to reliable and convenient workplaces and public charging stations is crucial in supporting EV customers. As of the close of 2022, the United States boasted around 136,000 EV charging ports. By year's end 2023, this figure had risen by 21%, reaching an estimated total of 165,000 charging ports distributed across more than 61,000 stations nationwide.
 Source: AFDC, US Department of Energy
Most of the charging ports available are Level 2 chargers, which account for 76% of all public charging ports in the US. DC fast chargers make up around 24%, with the majority (62%) of these fast chargers on the Tesla Supercharger network and therefore only accessible to Tesla drivers except in some select stations. There are currently more than 24,000 Tesla Superchargers in the US that can add about 200 miles of range to a Tesla vehicle in 15 minutes.
Level 1 chargers can still be found in some public charging facilities. However, they are not very common and make up less than 1% of all charging points.
Nearly one-third of the nation's public charging infrastructures are in California. The state has the most significant number of EV charger points by volume (44,000), far outpacing the rest of the country. New York, ranked second, has around 10,000 charger points, less than one-fourth the number of EV chargers as California. Texas is in third position with nearly 9,000 charging points.
Charging infrastructures outside urban areas are not getting enough attention currently. Although EV adoption is slow in these areas, it's still important to have enough charging stations there. Around 85% of Level 3 (fast) chargers and 89% of Level 2 (regular) chargers are located within US Metropolitan Statistical Areas (MSAs), areas with a high density of population. The same can be said about the Tesla charging network. 82% of its Superchargers (fast) and 83% of its destination chargers (regular) are located within MSAs.

Does the United States Have Enough EV Chargers?
US EV market share for new vehicles is likely to reach 30% or more by 2030, at which point the total number of EVs in operation could reach 26.4 million. The Edison Institute generated these numbers by aggregating many other forecasts from different organizations (e.g.: Deloitte, Boston Consulting Group, Guidehouse, Wood Mackenzie).
Approximately 12.9 million charging ports will be needed to support the 26 million EVs projected to be on US roads in 2030. This would be a mix between home charging, workplace charging, and public facilities with a composition of 74% (9.5 million ports) home and multifamily Level 2 charging, 9% (1.2 million ports) workplace level 2 charging, 16% (2 million ports) public level 2 charging, and 1% (140,000 ports) public DC fast charging, as reported by S&P Global Mobility.
While DC fast charging ports make up only 1% of the EV charging infrastructure needed in 2030, these charging stations are vital and should become a top priority for policymakers, third-party charging providers, and electric companies. However, they are also much more costly than lower-powered Level 2 stations, often costing hundreds of thousands of dollars per station.
Top EV Charging Companies in the United States
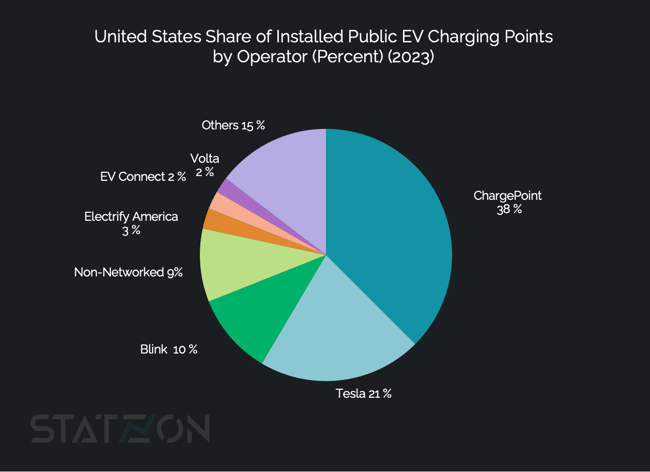
Combining the number of charger ports and locations across all levels of EV chargers, ChargePoint ranks well above all other networks and is easily the largest EV charging network in the US, accounting for 37% of all US public charging ports. Currently, ChargePoint is managing over 61,000 charging ports spread across 34,000 locations in the US.
 Source: AFDC
Tesla is in the number two spot for the overall charging network, but it dominates the DC fast charging market. Tesla Supercharger is currently available to Tesla drivers only, yet Tesla has the highest number of EV sales compared to other automakers, therefore, the network caters to a big proportion of EVs on the road.
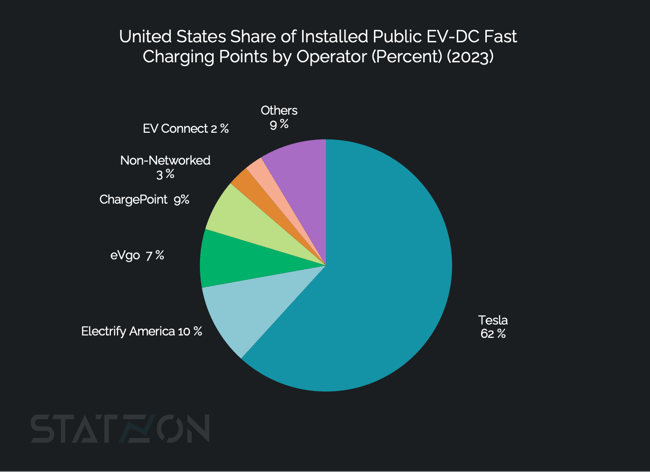
Tesla Supercharger network is known for having the fastest and smoothest charging experience. With 24,000 superchargers spread over 2100 locations, Supercharger accounts for 62% of total DC fast charger ports in the US.
 Source: AFDC
Considering both Destination charging and the Supercharger network, the Tesla charging infrastructure represents 21% of all U.S. charging points, comprising 34,000 charging ports across 6,400 locations.
Next in line after Tesla is Blink, which expanded its network by acquiring SemaConnect in June 2022, holding a 10% market share. This is followed by Electrify America with 2.6% and EV Connect with 2.4%. Around 15,000 (9%) of public charger ports do not belong to any network and the rest are managed by various smaller operators
Within the fast-charging domain, Electrify America holds the second position after Tesla with a 10% market share, followed by EVgo in third with 7.5%, ChargePoint in fourth with 6.7%, and EVConnect ranking fifth with a 2.3% share. Approximately 1,100 ports, accounting for a 2.7% share, are classified under the "Non-networked" category.
Source: Statzon, Kelley Blue Book , WSJ, Alliance for Automotive Innovation, Copilot, SP Global Mobility, EVAdoption, EEI, electreck.co, CleanTechnica, COX Automotive, COX Automotive (2), CarEdge, Nasdaq.com, ev-columes.com, ICCT, Bloomberg NEF, caranddriver.com, Reuters, energy.gov, AFDC,