The electric vehicle market experienced strong growth in 2023, driving significant expansion in the EV battery market. The outlook for EV sales remains bright, promising several more years of remarkable sales growth for battery companies. In 2023, nearly 14 million new electric cars were registered globally, increasing the total number of EVs on the road to 40 million. Electric car sales 2023 were 3.5 million higher than in 2022, marking a 35% year-on-year increase. This is more than six times higher than in 2018, just five years earlier. In 2023, there were over 250,000 new registrations per week, surpassing the annual total from 2013, a decade earlier.
Electric vehicle battery market size
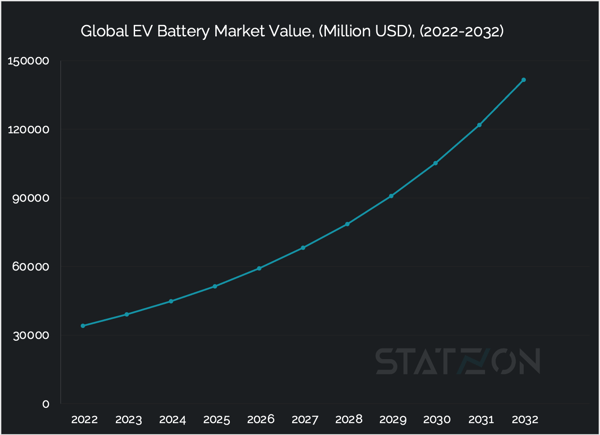
The research company Apollo Research Reports estimated the 2022 EV battery market value at USD 34 billion. This number is projected to reach USD 141.6 billion by 2032, growing at a CAGR of 15.4% from 2023 to 2032. The passenger car segment is the highest contributor to the market compared to any other type of vehicle, accounting for USD 24.9 billion, and is anticipated to reach USD 99.8 billion by 2032, growing at a CAGR of 14.9%. The other two types of vehicles measured by Apollo Research, two-wheeler, and commercial vehicle will experience significant growth rates at a CAGR of 18.2% and 16.1% respectively. Share of these two segments is estimated at around 27% in the overall EV Battery market in 2022.
When the market is segmented into types of propulsion, battery electric vehicles (BEVs) are dominating, controlling around 70% share of the market in 2022. With an expected annual growth rate of 14.9%, the market value for this segment is anticipated to reach USD 94.9 billion by 2032. Hybrid vehicles take up the rest 30% of the market.
 Source: Statzon/ Apollo Research Reports
Electric vehicle battery types
The three most common types of batteries used in electric vehicles are lithium-ion, nickel-metal hydride, and lead-acid batteries.
Lithium-Ion Batteries
Lithium-ion batteries are the most popular and considered the best batteries for electric vehicles. They are also used in many portable consumer electronics because of their power-to-weight ratio, meaning that they have great charge-holding capacity even at a smaller size.
Most BEVs and PHEVs use lithium-ion batteries, though the exact chemistry often varies from that of consumer electronics batteries.
Based on Apollo Research Reports data, lithium-ion batteries contributed USD 21.5 billion to the EV battery market. That is about 63% of the total market value.
Nickel-Metal Hydride Batteries
Nickel-metal hydride batteries are used mostly in hybrid-electric vehicles (HEV). This type of battery offers reasonable energy and power capabilities combined with a longer life cycle compared to lead-acid batteries. The main challenges with nickel-metal hydride batteries are their high cost, high self-discharge, and heat generation at high temperatures, making it less viable to scale up to full-fledged EV use.
Nickel-metal hydride batteries accounted for a 5% share of the total EV battery market.
Lead-acid Batteries
Lead-acid batteries are the oldest rechargeable batteries. These batteries offer a low-cost, safe, and dependable solution and can be engineered to deliver high power output. However, they are usually heavy and have a faster discharge rate, poor cold-temperature performance, and short lifecycle. Lead-acid batteries in electric vehicles are used only to supplement other battery loads.
The market for lead-acid batteries for EV uses was valued at USD 10.5 billion in 2022, taking up 31% of the total market share.
Lithium batteries chemistries used in electric vehicles
Lithium-ion batteries for electric cars are usually categorized based on their cathode composition. The most prevalent chemistries utilized in electric vehicles at present are NMC, NCA, and LFP (lithium iron phosphate), referring to the materials used in the cathode (the positive electrode) of the batteries such as nickel (N), manganese (M), cobalt (C), aluminum (A), iron (F), and phosphate (P).
In general, nickel-based batteries such as NMC and NCA deliver superior performance. These chemistries are used by major automakers such as Tesla, Volkswagen, BMW, and Audi. However, they are also the most expensive due scarcity of cobalt in earth’s crust, and higher nickel content means more complex and controlled production processes. LFP chemistries, on the other hand, offer higher service life and affordability, although the performance is generally lower than NMC and NCA chemistries.
From the International Energy Association (IEA) report, NMC and NCA were the dominant chemistries in the electric car battery market in 2021, with 75% of cathode material demand share due to their advantages for driving range. However, surge of EV adoptions in China during the last two years created an upswing for the LFP market that it seized a 25% share of the market in 2021 (from 11% in the previous year) and accelerated to 31% towards the end of 2022. LFP is used for most medium and heavy-duty vehicles in China but Tesla and BYD, the two biggest EV manufacturers in the world, started to release electric passenger cars powered by LFPs.
Tesla first used LFP batteries made by the Chinese company CLTA for its China-made Model 3 in 2020. By the first quarter of 2022, Tesla announced that over half of its production was equipped with an LFP pack. Meanwhile, BYD and other EV makers in China are also becoming heavy users of LFP. LFP technology accounted for 57% of total EV battery production in China in 2021. 
Electric vehicle battery price
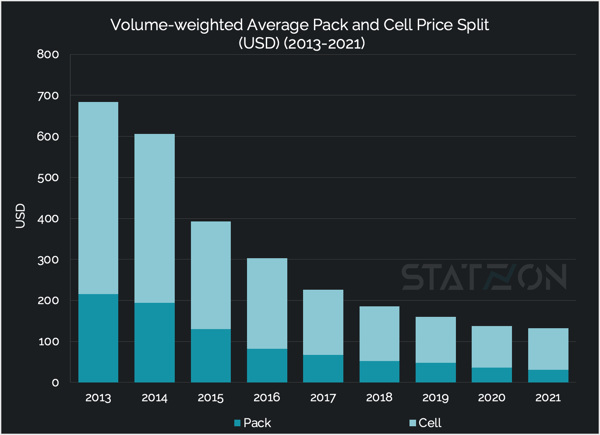
Bloomberg NEF tracked the cost of lithium-ion batteries from 2010-2021 and saw an almost 90% fall in price between those years, from USD 1200 to USD 141/kWh. After a decade of steady decline, the price for lithium-ion battery packs rose by 7% in 2022 to USD 151/kWh. Supply chain disruptions have significantly increased the price of key materials by more than 20%. Nickel, for example, is now 2-3 times more expensive since the war in Ukraine started.
Batteries typically account for 30% to 40% of the value of an electric vehicle. The rising price of electric car batteries will halt the production of more affordable BEVs for the mass market. The price of lithium-ion batteries will stay at USD 152/kWh in 2023, BNEF predicts. More lithium production is expected to come in 2024 and hopefully bring the price down.
Source: BloombergNEF
Electric vehicle battery market share of the top ten companies
Chinese battery manufacturers have exerted their dominance over global supply of electric vehicles battery. Six out of the global top ten EV battery companies are Chinese, led by Contemporary Amperex Technology, more commonly known as CATL, with an impressive 37.1% share of the market based on the latest report from SNE Research published in January 2023. CATL supplies EV batteries to automakers giants including Tesla, Honda, Volkswagen, Volvo, BMW, Dongfeng Motor, and SAIC Motor. The company experienced a two-fold growth between 2021-2022, and all the other Chinese companies in the top ten list, including the giant company BYD, have demonstrated remarkable over 100% growth.
BYD's market share of electric car battery installation reached 13.6% in 2022. Securing the second position in the top ten list. The company experienced three-fold installation growth from 22.6 GWh in 2021 to 60.6 GWh in 2022.
The list also includes three Korean companies and one Japanese. Despite efforts from both the US and Europe to boost their domestic battery production, Asian suppliers maintain their dominance in the market.
Together, the top ten EV battery companies make up 90% of the global battery installation for electric vehicles.
| Rank | Company Name | 2021 Installation (GWH) | 2022 Installation (GWH) | Growth Rate | 2021 Market Share | 2022 Market Share |
| 1 | CATL | 82.1 | 165.7 | 101.8% | 32.2% | 37.1% |
| 2 | BYD | 22.6 | 60.6 | 168.3% | 8.8% | 13.6% |
| 3 | LG Energy Solution | 49.9 | 54.8 | 9.7% | 19.6% | 12.3% |
| 4 | Panasonic | 32.6 | 34.1 | 4.7% | 12.8% | 7.7% |
| 5 | SK On | 15.2 | 26.1 | 72% | 6% | 5.9% |
| 6 | Samsung SDI | 12.6 | 22.1 | 74.9% | 5% | 5.0% |
| 7 | CALB | 6.8 | 17.8 | 161.3% | 2.7% | 4.0% |
| 8 | Guoxuan | 5.5 | 12.7 | 131.5% | 2.1% | 2.8% |
| 9 | Sunwoda | 1.9 | 7.5 | 287.3% | 0.8% | 1.7% |
| 10 | EVE | 2.8 | 5.9 | 110.3% | 1.1% | 1.3% |
| Others | 23.2 | 38.6 | 66.5% | 9.1% | 8.7% |
Source: SNE Research
More electric mobility insights
Source: Statzon, SNE Research, BlombergNEF, BloombergNEF (2), IEA (1), IEA (2), InsideEVs, Business Insider, Reuters, Tesla
