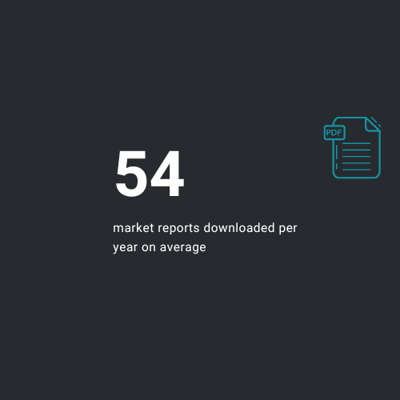
We analyzed Statzon customer usage data for the past year to understand how they use Statzon. On average, our customer downloads 54 market research reports a year.
Of course, the frequency of usage is not distributed evenly throughout the year. There are times of the year or specific projects which require more market insights. Some are using Statzon weekly, others monthly, and a few quarterly.
What does that mean in Euros?
The average market research report price is around 4000€, and the dataset, if purchased separately, is around 100€.
Assuming our average customer would purchase each report and dataset from traditional marketplaces, they would spend 18 000 €/month to buy reports and 1100€/month to view datasets based on average views on datasets, which sums up to 229 200 €/year. That would be an enormous investment in market information. How many companies are spending that much on-market information? Not many.
More market information is consumed
 Usually, during the sales process, we ask our customers how many reports they purchased in the past 12 months. Typically people answer anything between 1-10. Very few have bought more than ten reports in a year. However, once they started using Statzon, they consumed just in Statzon on average 54 market reports in a year. Yes, our customers download 54 market research reports annually on average. That is a massive jump from 1-10.
Before the Statzon subscription, the purchase of any report was an investment decision. Users had to consider the whole year's budget and whether the report was relevant and needed. However, with fixed costs, users are free to access any market information they need without thinking about expenses, and they can do so easily.
Subscription-based access to market information brings a huge benefit compared to purchasing individual reports. When you buy the report, you decide to trust its content. When you can access reports and datasets from several sources, you get the possibility to cross-check the data and forecasts to get more reliable information to support your decisions.
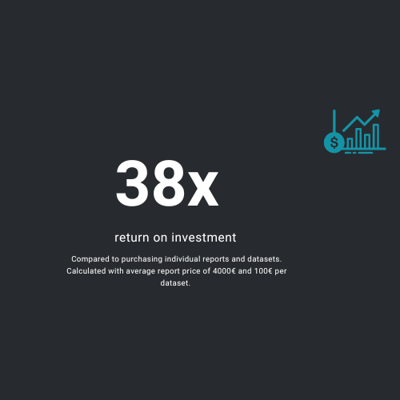
38x Return on investment
 We also calculated the value our customers receive when using Statzon. Customers get, on average, 38 x return on investment for their subscription fees when calculated using average prices for reports and datasets mentioned earlier.
These statistics here are only covering the paid customers. We offer free access to worldwide and regional datasets for free users. So if you haven't tried Statzon yet, get a free account, browse through millions of market insights and find interesting market insights!
How is Statzon used?
Our customers have a variety of use cases for market information; here are a few examples.
Faster market entry
Medicaroid Europe GmbH had a challenge: they were entirely new for the European market, with zero medical devices installed in the region's hospitals. They also aspired to compete against the industry's giants, such as Medtronic and Johnson & Johnson, in the next five years. However, they lacked precise and reliable market figures, even though the goal was to define the market expansion plan within the following years. That's when they started with Statzon. Read the whole Medicaroid story here.
Single point of truth for market information
At Stäubli, market information was actively used and purchased before starting with Statzon. However, purchasing and managing information was scattered. With Statzon, Stäubli was able to consolidate market information management and get transparency on their spending. Read the Stäubli customer case story here. 
