In the ever-evolving quest for sustainable and clean energy, solar power has emerged not just as a viable option but as a fundamental cornerstone for the future of global energy. As the most widely available energy resource on Earth, solar electricity generation distinguishes itself with a minimal carbon footprint, making it a leading technology for large-scale use that can help reduce climate change risks. This has led to a huge increase in solar power capacity around the world, moving us towards the goal of using solar energy on a massive scale for a greener future.
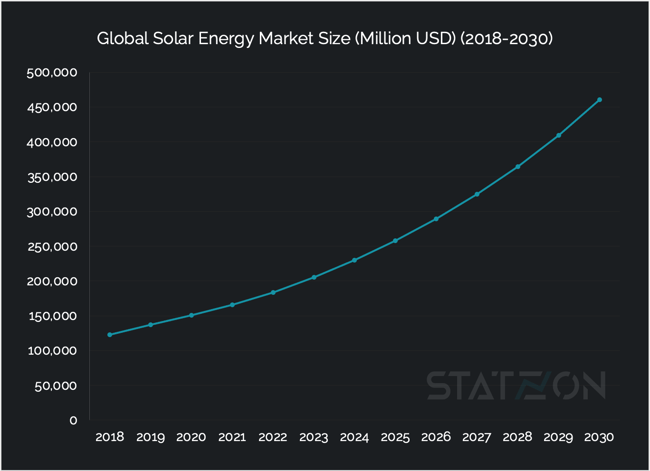
Global Solar Energy System Market Value
The market for solar energy has witnessed a transformative period of growth, with installed capacity reaching new heights and technological advancements driving down costs while enhancing performance. The global solar power market is currently growing at a 12.17% CAGR with the market value projected to more than double from USD 183.7 billion in 2022 to USD 460.5 billion by 2030, based on data from 360iResearch. This surge is underpinned by a record-breaking year where renewable capacity additions rose by almost 50% to nearly 510 GW, with solar PV leading the charge, particularly in markets like China. Furthermore, the daily investment in solar deployment surpassing USD 1 billion signifies the scale of global commitment and the industry's vibrant potential for further growth, mirroring the optimistic solar energy industry outlook.
 Source: Statzon/ 360iResearch
Installed Capacity of Solar Power
In 2022, global solar photovoltaic (PV) capacity surpassed the terawatt milestone for the first time. Throughout the year, the installed capacity of solar energy (representing the maximum power output achievable under optimal conditions) has been growing from a humble 1.23 gigawatts (GW) in 2000 to a monumental 1412 GW by 2023.
 Source: International Renewable Energy Agency (IRENA)
The annual net additions of new installations have also been consistently trending upward, reaching 345 GW in 2023, marking an impressive 73% increase over the previous year.
Bloomberg forecasts a new record with an anticipated 520 GW of solar PV installations in 2024. The market is thriving, with solar module prices at historic lows and component supplies abundant.
China led the charge, contributing approximately 60% of the global net additions, and shows no signs of slowing down. New markets are emerging worldwide. China's renewable electricity capacity growth is set to triple over the next five years compared to the previous five, with the country accounting for an unprecedented 56% of global expansion. From 2023 to 2028, China is projected to deploy nearly four times more renewable capacity than the European Union and five times more than the United States.
In the early 2000s, solar energy's contribution to global electricity was negligible, representing only 0.15% of total electricity generation. However, its significance has steadily increased over the years. Solar PV now accounts for 4.5% of total global electricity generation, remaining the third-largest renewable electricity technology behind hydropower and wind.
Solar Power in the Renewable Energy Mix
How much renewable energy do we have in our energy mix? From the early 2000s, where renewables contributed merely 18.91% to the global electricity mix, we've seen an upward trajectory, reaching 29.5% by 2022.
In early 2000, hydropower was the undisputed leader of the renewable sector, comprising about 90% of the renewable energy mix and contributing to 17% of the total global electricity production. Fast forward to the present, and while the landscape of renewable energy has evolved, hydropower still maintains a significant presence, representing around 15% of the total energy mix.
The rise of other renewable energies has been striking, particularly for solar and wind power, which have grown not only in capacity but also in technological sophistication. Solar power, which once barely registered in global statistics, now commands around 4.5% of the total energy mix. The third source of renewable energy after hydropower and wind energy made up 14.5% and 7.1% of the total energy mix in 2022, respectively.

Within the renewable energy sector itself, hydropower, remains the biggest player, providing more than half of all the clean energy we produce. As of 2022, it's responsible for 51% of it. Solar panels now give us 15.6% of our renewable energy, showing just how much this technology has grown. Wind turbines are creating 24.7% of our renewable energy. Bioenergy, which comes from biomass, chips in another 8%, while other renewable energy sources, such as geothermal energy, add 1%.


Declining Cost of Solar Energy Systems
The declining costs of solar energy systems and their components over the past decade have been a driving force in the renewable energy transition. The cost of solar photovoltaic (PV) power has seen a dramatic reduction, falling by 89% from 2010 to 2022. This decline has been consistent and significant, with solar PV module prices dropping by around 30-40% in 2023 alone, thanks to various factors including supply-demand imbalances in China and an expansion of manufacturing capacities.
Battery costs, which are essential for storing solar energy to ensure a stable and consistent supply, have also decreased substantially. From 2008 to 2022, the costs for batteries fell by about 90%, mirroring the reductions seen in solar PV technologies.
Despite this overall trend, there have been some variations. In 2023, for example, the cost of residential solar PV systems decreased, benefiting from technological advances and policy measures like the Inflation Reduction Act in the US, which provided tax incentives for clean energy technologies. However, the costs for utility-scale solar systems have seen a slight increase due to higher prices for components like inverters and labor, as well as the electrical balance of system costs.
Globally, the levelized cost of electricity (LCOE) from newly commissioned utility-scale solar PV fell by 3% from 2021 to 2022, despite rising material and equipment costs, indicating that solar power continues to become more competitive even in the face of broader economic pressures. Solar power has become cheaper than wind in many regions of the United States, with power purchase agreements (PPAs) for solar now often costing less than those for wind power.
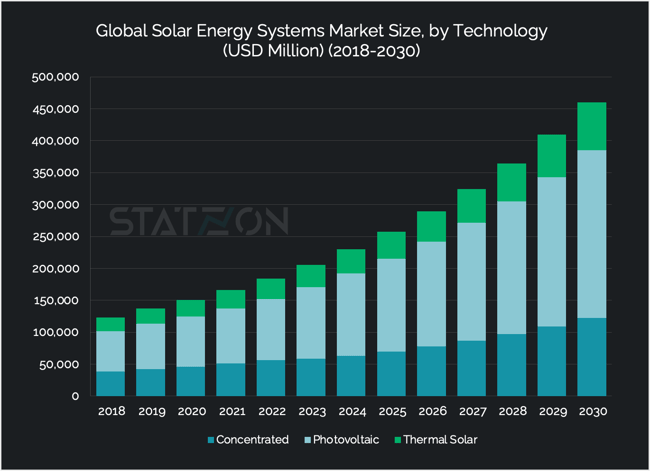
The Solar Energy System Market by Technology
Within the vast array of solar energy technologies, photovoltaic (PV) systems clearly lead the pack. In 2022 alone, they generated about 1300 terawatt-hours (TWh) of electricity, highlighting their critical role in the shift towards renewable energy. Their standout features include not only efficiency and scalability but also significant technological advancements that have drastically reduced costs. This combination has made PV systems both more affordable and widely used, establishing them as the primary choice for solar energy. Reflecting this leadership, the market value of PV systems was USD 95.76 billion in 2022, with projections indicating a rise to USD 262.99 billion by 2030, achieving a CAGR of 12.59%, the highest among the segments.
In contrast, concentrated solar power (CSP) occupies a specialized yet crucial space within the solar energy field. Although its 2020 electricity output of 14.5 TWh, as reported by the International Energy Agency (IEA), seems small compared to PV, the anticipated increase to over 200 TWh by 2030 underlines its escalating significance. With a market value of USD 56.19 billion in 2022 and an expected growth to USD 122.22 billion by 2030, reflecting a CAGR of 10.16%, CSP is poised to play a significant role in the energy sector. This is largely due to its unique capability for dispatchable power generation and grid stability enhancement through thermal energy storage, despite requiring a higher initial investment than PV systems.
Solar thermal energy, although smaller in market size with a value of USD 31.79 billion in 2022 and an anticipated increase to USD 75.21 billion by 2030, showcasing a CAGR of 11.00%, remains an indispensable element of the solar energy landscape. This technology enhances the diversity of solar applications by providing solutions for heating and cooling, or even electricity generation under certain setups. While it doesn't match the electricity generation levels of PV systems, solar thermal technology significantly contributes to reducing the reliance on fossil fuels for heating purposes, highlighting the versatile benefits of solar energy.
 Source: Statzon/ 360iResearch
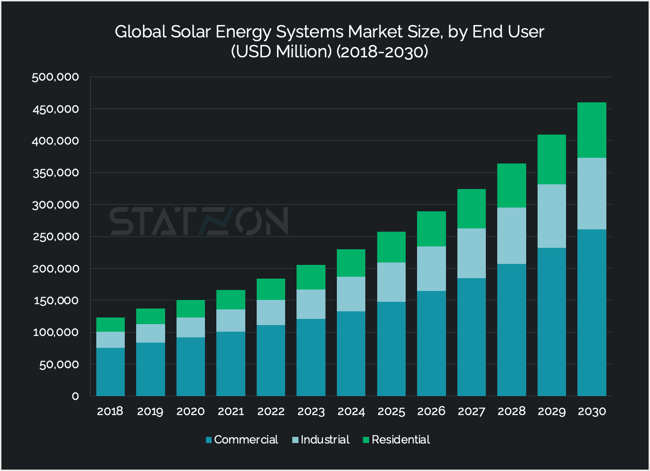
Rising Demand for Residential Solar Energy Systems
Initially, solar power was predominantly used in off-grid and low-grid areas as a primary means to generate electricity where traditional power infrastructure was absent or insufficient. This application provided essential power to remote locations, demonstrating the versatility and reliability of solar energy in diverse settings. However, the appeal of solar energy has expanded well beyond these initial applications, becoming increasingly popular among homeowners connected to the grid. This shift is largely motivated by the desire to gain greater control over electricity spending, reduce environmental impact, and enhance energy independence.
Today, residential solar installations, often complemented by battery storage systems, allow homeowners to not only generate their own electricity but also store surplus energy for later use or sell it back to the grid. This capability has revolutionized the way energy is consumed and produced at the household level, enabling homeowners to significantly reduce their reliance on utility companies and decrease their electricity bills.
The growth of the residential solar market can be seen by a surge in demand, with the market value projected to rise from USD 33.29 billion in 2022 to USD 87.57 billion by 2030. This expansion is fueled by technological advancements, declining installation costs, and supportive government policies, making solar energy an increasingly accessible and attractive option for a wide range of consumers.
 Source: Statzon/ 360iResearch
In the industrial and commercial sectors, the adoption of solar energy systems is driven by a combination of economic and environmental motivations. Businesses and industrial operations are turning to solar power to mitigate their energy expenses and carbon footprints. The commercial solar market, valued at USD 111.44 billion in 2022, is projected to grow to USD 261.29 billion by 2030, and the industrial sector, from USD 39.01 billion in 2022 to USD 111.56 billion by 2030, are both harnessing solar energy to achieve sustainability goals while benefiting from cost savings. Generating electricity on-site not only provides businesses with a hedge against rising energy prices but also enables them to benefit from strategies like peak shaving, which can significantly reduce electricity costs during periods of high demand.
Solar energy's role in the industrial and commercial sectors is pivotal, as these areas account for a significant portion of global energy consumption. The industrial sector, for example, was responsible for 33% of total U.S. energy consumption and 35% of Europe's total electricity consumption in 2022. By integrating solar power, these sectors can significantly reduce their environmental impact while ensuring a stable and cost-effective energy supply.
Source: Statzon, IEA (1), IEA (2), IRENA (1), IRENA (2), Bloomberg NEF, Our World in Data (1), Our World in Data (2), energypost.eu, SolarPower Europe, CleanTechnica, Ember, Energy Institute Statistical Review, pv-magazine.com, Global Solar Energy Market Size 2018-2030 (360iResearch), Global, Solar Energy System Market Size by Technology 2018-2030 (360iResearch), Global Solar Energy System Market Size by End User 2018-2030 (360iResearch)
